Main
🏠 Home ℹ️ About Us
WhatsApp
💬 WhatsApp Business API (WABA) 🔐 OTP & TAC via WhatsApp 🤖 WhatsApp + AI Chatbot 🔵 Blue Tick Verification 🤖 AI Chatbot & Auto-Response 🎨 Automation Flow Builder 🔘 Interactive Messages 💡 Automation Use Cases 📱 Business App Coexistence
SMS
📱 One-Way Bulk SMS 🔒 Two-Factor Authentication (2FA) 🌏 Global SMS Coverage ⚡ SMS API
Email & API
✉️ Email Service Overview 🔌 Email SMTP API 🛠 REST API Reference
Queue System
🏢 Queue System Overview 💬 WhatsApp QMS ☁️ Cloud QMS ⚡ Cloud + WhatsApp QMS 📖 Cloud & WhatsApp QMS Guide 🎯 Request Free Demo
Pricing
💰 Full SGD Rate List 🛒 Buy SMS Credits
Support
📩 Contact Us ❓ FAQ 📖 End-User Guide ⚠️ Service Advisory
🔑 Login 📝 Register Free

Chapter 14 · Part 2

Generate & View SMS Reports

iSMS gives you a few ways to review your sending: a monthly summary, a day-by-day summary, and a calendar view you can click into. Every view can be filtered by date and exported to Excel.

Three ways to view your activity

Open your reports from the SMS menu. Pick the view that suits what you need — a high-level monthly trend, daily detail, or a calendar at a glance.

Monthly Summary

Totals and trends month by month, with credits used and a peak month.

Daily Summary

Day-by-day counts and credit charge, with a peak day and delivery rate.
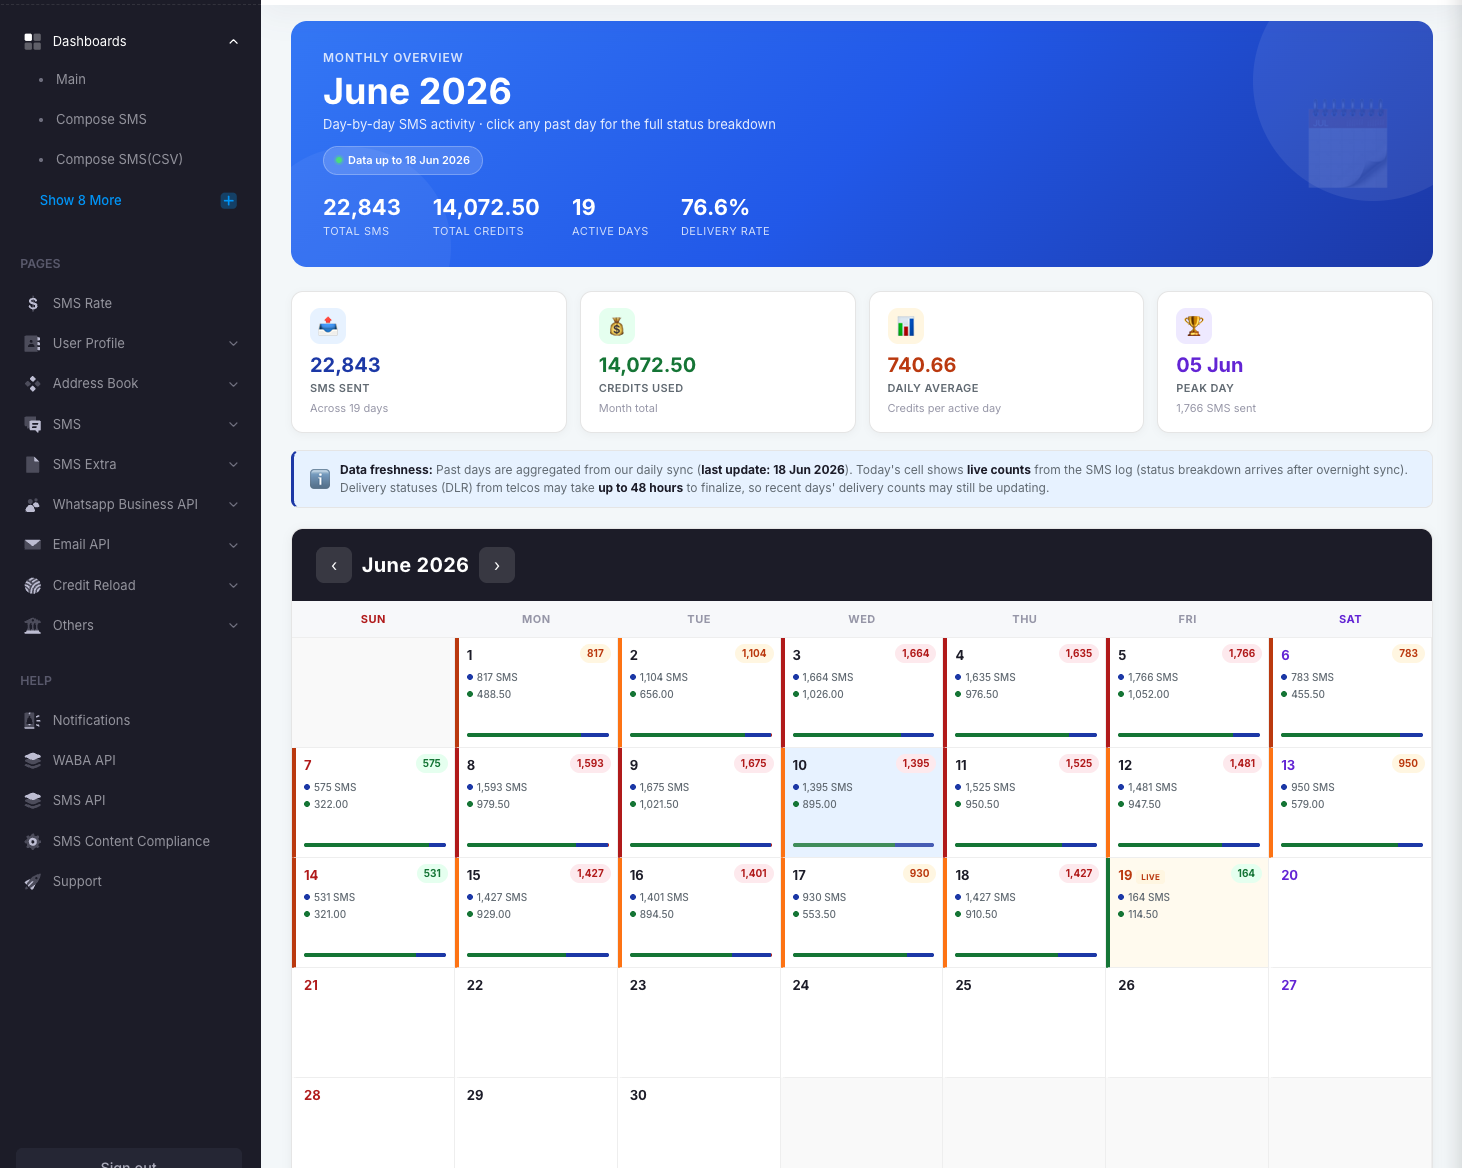
Daily Calendar

A month grid showing each day’s SMS — click any day for the full breakdown.

By account

Per-user and sub-account breakdowns — see the Summary Report.
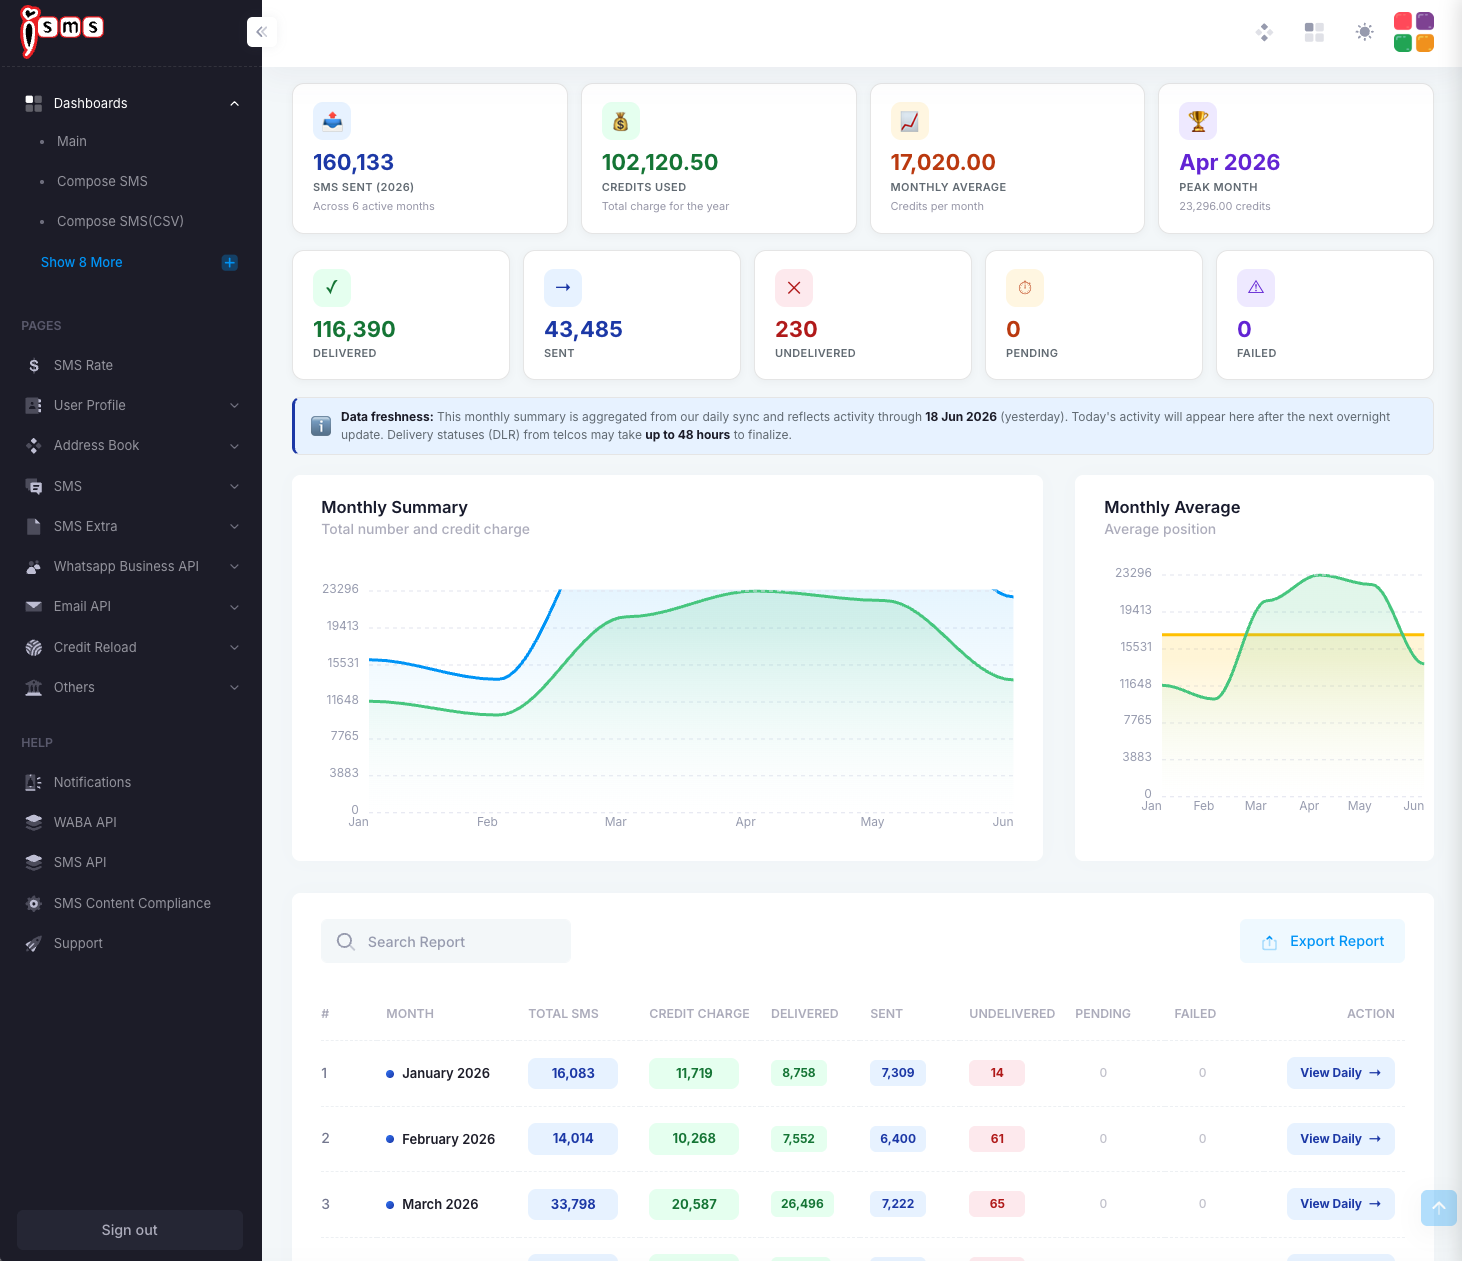
Monthly Summary

Shows your year at a glance — total SMS sent, credits used, monthly average, and your peak month — with delivered / sent / undelivered counts, trend charts, and a month-by-month table. Use View Daily on any row to drill into that month.

The iSMS Monthly Summary report: yearly totals, status counts, monthly trend charts, and a month-by-month table.
Fig. 1Monthly Summary — yearly totals, trend charts, and a per-month table.

Daily Summary

Breaks a month down by day, with credit charge, totals, and delivery status per day, plus daily trend charts and your busiest day.
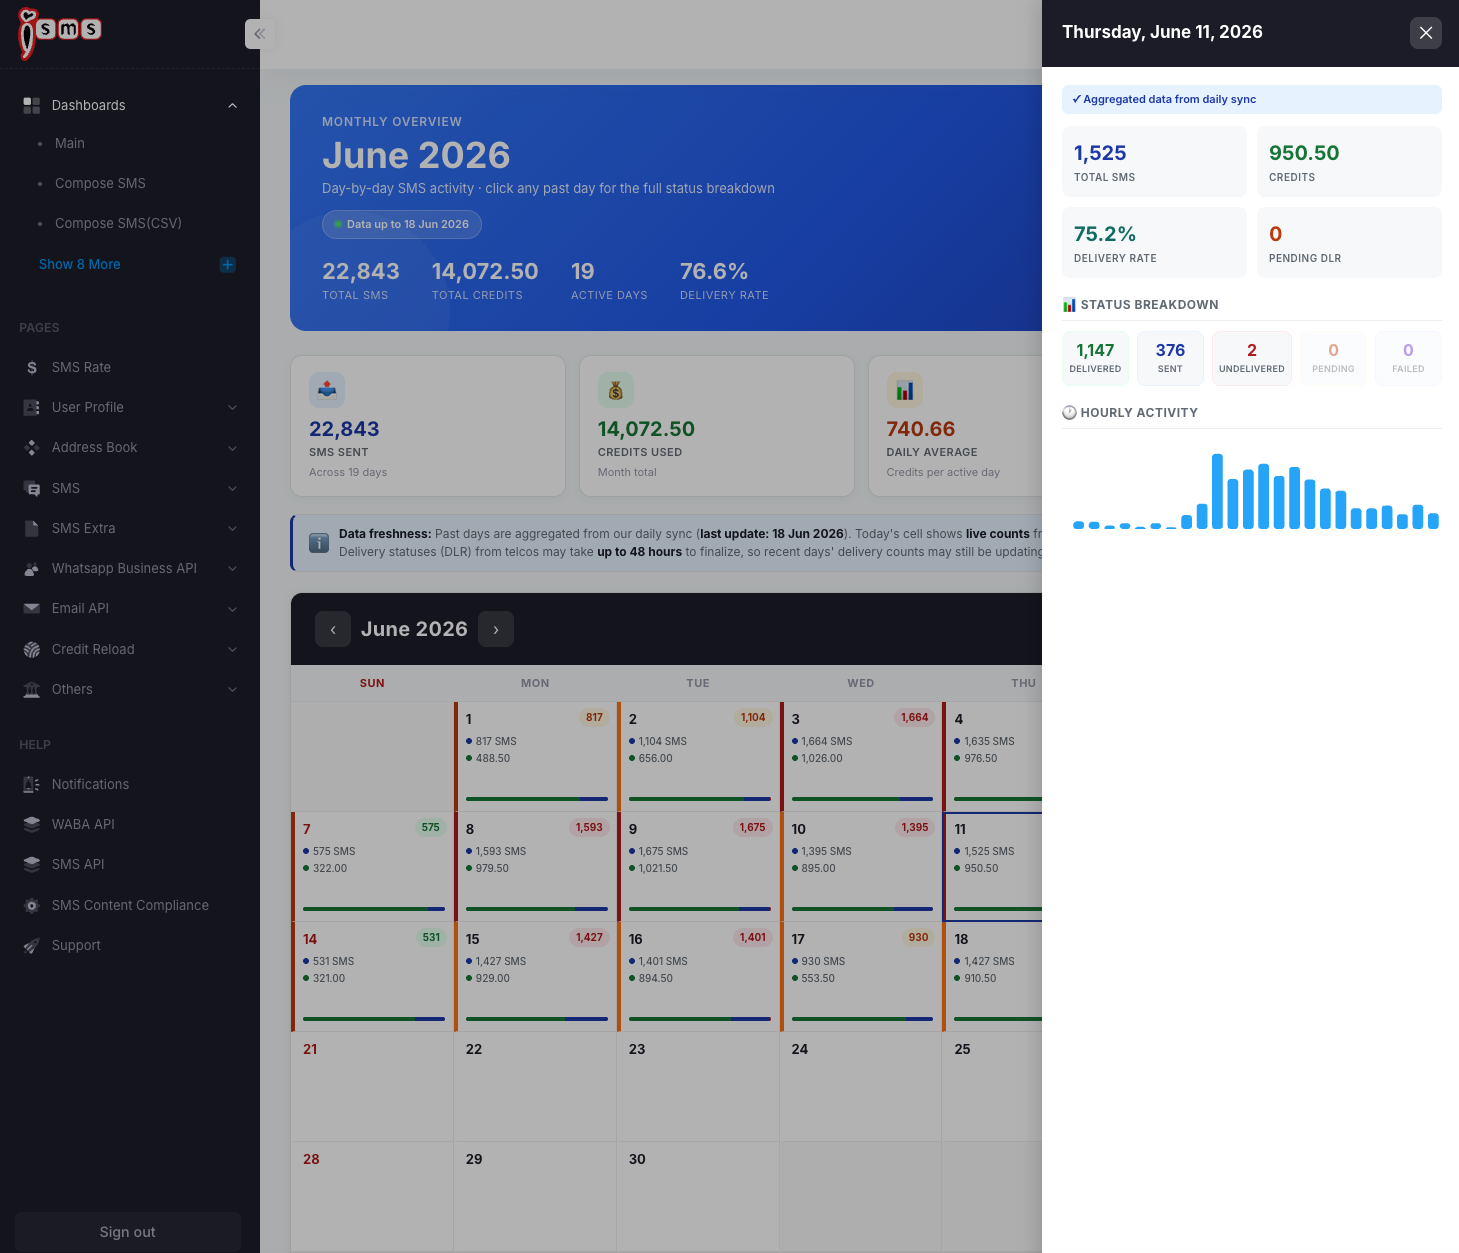
The iSMS Daily Summary report: per-day totals, credit charge, status counts, and daily trend charts.
Fig. 2Daily Summary — day-by-day totals and a per-day table.

Daily Calendar

Lays the month out as a calendar, with each day showing its SMS count and credit. Click any day to open a side panel with the full status breakdown and hourly activity.

The iSMS Daily Calendar report: a month grid with each day's SMS count and credit charge.
Fig. 3Daily Calendar — the whole month at a glance.
A single day selected in the calendar, showing total SMS, credits, delivery rate, status breakdown, and hourly activity.
Fig. 4Click a day to see its status breakdown and hourly activity.
Filter & export: use the date range and search box to narrow any report, then click Export Report to download it to Excel for billing or campaign reviews.
Data freshness: past days are aggregated from the overnight sync; today’s row shows live counts. Delivery statuses (DLR) from the telcos can take up to 48 hours to finalise, so recent days may still be updating.
Need help?
Our team is happy to assist with anything in this guide. Contact us →
💬